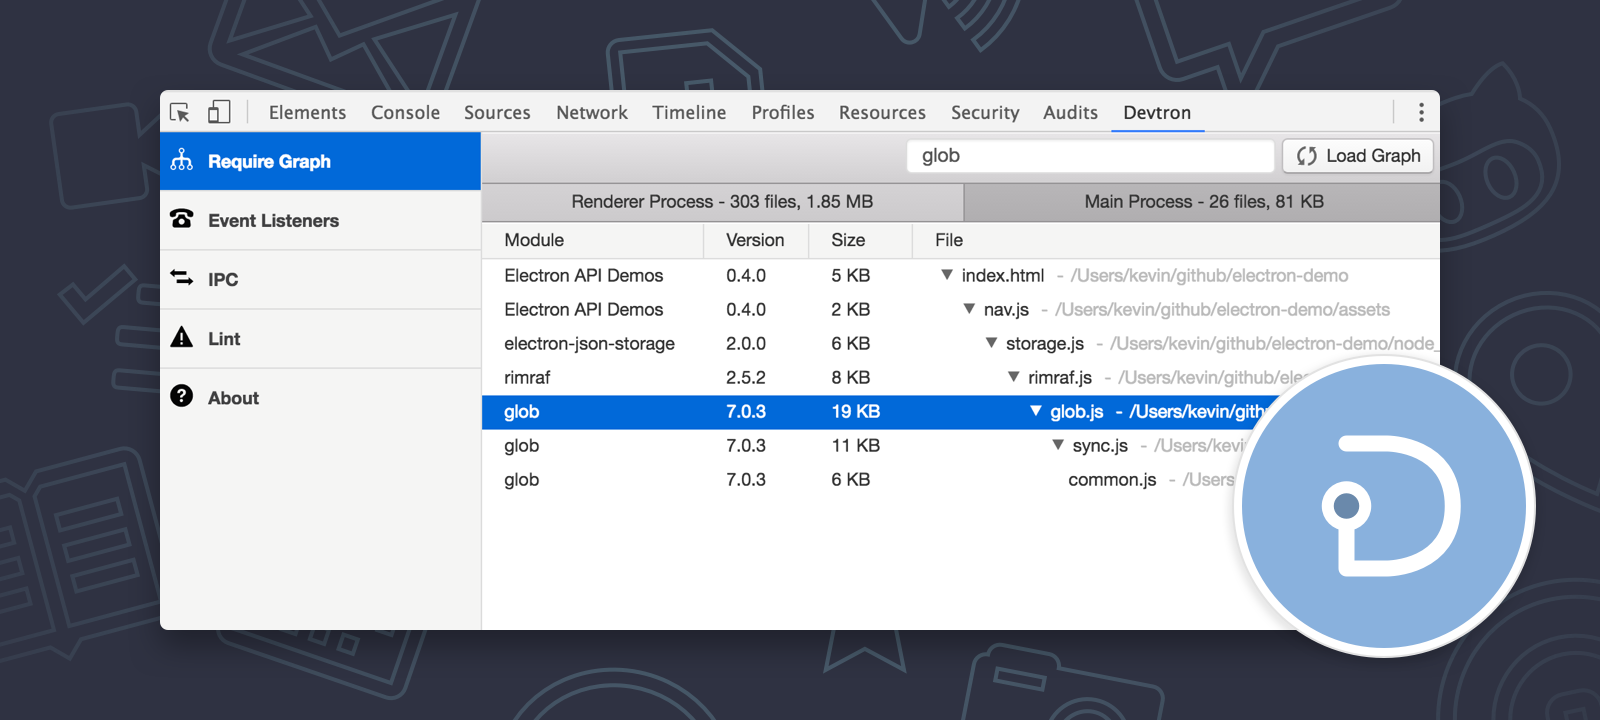
 Devtron
An Electron DevTools extension to help you inspect, monitor, and debug your app.

npm install --save-dev devtronThen execute the following from the Console tab of your running Electron app's developer tools:
require('devtron').install()You should then see a Devtron tab added.
If your application's BrowserWindow was created with nodeIntegration set
to false then you will need to expose some globals via a preload
script to allow Devtron access to Electron APIs:
window.__devtron = {require: require, process: process}Then restart your application and Devtron should successfully load. You may
want to guard this assignment with a if (process.env.NODE_ENV === 'development')
check to ensure these variables aren't exposed in production.
git clone https://github.com/electron/devtron
cd devtron
npm install
npm start
This will start a process that watches and compiles the extension as files are modified.
Then open the Console tab of your Electron app and run the following with the path updated for the location that you've cloned devtron to:
require('/Users/me/code/devtron').install()Then a Devtron tab should appear and it will now be enabled for that application.
You can reload the extension by closing and reopening the dev tools.
To make developing and debugging the extension easier, you can run it in a Chrome tab that will talk remotely to a running Electron app over HTTP.
Set the DEVTRON_DEBUG_PATH environment variable to the path of the cloned
devtron repository.
Start your Electron application.
Click the Devtron tab.
You should then see the following messages logged to the Console tab:
Devtron server listening on http://localhost:3948
Open file:///Users/me/devtron/static/index.html to view
Then open /Users/me/devtron/static/index.html in Chrome
The page there will talk remotely to the running Electron app so you'll be able to fully interact with each pane with real data.
require('devtron').install() cannot be called before the ready event of the app module has been emitted.When using webpack, you may experience issues resolving __dirname. In accordance with the docs, __dirname is resolved at runtime on the compiled file.
You have to two solutions:
devtron from Webpack bundle with config.externalsdevtron files to the same folder as your compiled main process fileconfig.externals = [
function(context, request, callback) {
if (request.match(/devtron/)) {
return callback(null, 'commonjs ' + request)
}
callback()
}
]__dirname by setting:// in your webpack config for main process
{
target: 'electron-main',
node: {
__dirname: false,
}
}devtron/manifest.json is the same folder as your compiled main process js file.devtron/out/browser-globals.js is out/browser-globals.js relative to your compiled main process js file.You can copy files with copy-webpack-plugin.
const path = require('path');
const CopyWebpackPlugin = require('copy-webpack-plugin');

const copyFiles = [
  {
    from: path.resolve(__dirname, 'node_modules/devtron/manifest.json')
  },
  {
    from: path.resolve(__dirname, 'node_modules/devtron/out/browser-globals.js'),
    to: path.resolve(__dirname, 'out'),
  }
];

config.target = 'electron-main',
config.plugins = [
  new CopyWebpackPlugin(copyFiles),
]Have an idea for something this extension could do to make debugging Electron apps easier? Please open an issue.
Pull requests are also welcome and appreciated. Run npm test to run the
existing tests. This project uses the standard JavaScript style.
MIT